Merck's UX Research
I worked across three UXR projects that each stretched a different research muscle, which were surveys, interviews and building study plans
🌿In a nutshell…
During my 10-week internship at Merck, I worked across three UXR projects that each stretched a different research muscle — from analyzing quantitative survey data, to conducting interviews, to building a study plan from scratch. Together they gave me a full picture of what it means to do research inside a large organization.
Project 1: Chatbot Analysis
A separate team had recently deployed a chatbot and needed to understand how employees were actually using it. Our UXR team was brought in to analyze survey data and surface both what was working and what wasn't.
My approach had three parts:
Excel Graphs — I created Likert scale visualizations and quantitative charts to make patterns in the data immediately readable for a non-research audience
Net Promoter Score (NPS) — I calculated NPS for rating-scale questions to give the client a single, digestible measure of overall user satisfaction with the chatbot
Qualitative Tagging — I grouped open-ended responses by keyword themes and tracked frequency counts to identify the most common issues users were experiencing
Insights
The analysis revealed a split experience — users found the chatbot genuinely useful for locating documents and information databases, but recurring technical difficulties and an inability to retrieve specific sources undermined their confidence in it. I presented these findings to the client team, highlighting the most pressing issues and recommending concrete next steps for improvement.
Learnings
Storytelling with Data
This project taught me that presenting research to non-technical stakeholders requires a different kind of translation — not dumbing down the findings, but leading with the "so what" rather than the methodology. I structured the client presentation around the most actionable insights first, using plain language and visual summaries to make the data immediately usable for people who don't speak UX
Excel for Data Analysis
Working with a large survey dataset in Excel built real fluency with functions, formulas, and data visualization that I hadn't developed before. More importantly, it showed me how much of research analysis happens before any insight is written — in the cleaning, structuring, and querying of raw data
Project 2: Interviews on new feature
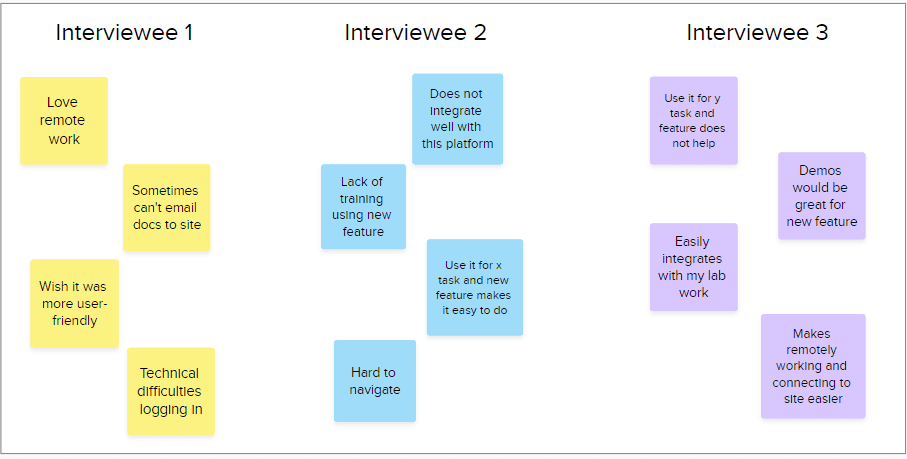
I conducted 6 interviews (30-45 minutes each) with two types of users of a remote work and site check-in platform that had recently added a new feature. Before drafting questions, I researched the platform and met with the client to understand what they needed from the study — which shaped the four areas I structured the interviews around: current platform usage, experience with the new feature, adequacy of training, and app integration. I included the last two categories specifically because the client wanted to understand not just whether users liked the feature, but whether the rollout had set them up for success.

Insights were synthesized collaboratively with a senior researcher and delivered to the client team as actionable recommendations.
Learnings
Interviewing is an active skill
Running these interviews with real employees builds a kind of confidence that I wouldn't have had from interviewing for school projects. I learned how to ask and reframe questions, probe deeper into their responses and when to move onto the next
Synthesis is where you get the big picture
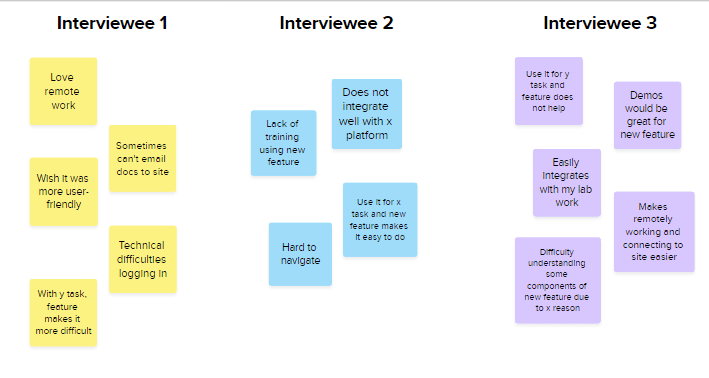
The interviews themselves are just data collection — the Mural affinity mapping session with the senior researcher was where the actual insights emerged. Working through that process showed you how raw quotes become patterns and how patterns become recommendations.
Project 3: UX study plan for user retention
Our client for this project said that their system, which tracks inventory information and lab sample locations in labs, has been seeing a decrease in user retention and wanted to find reasoning as to why. We were tasked with setting up the research study on how we wanted to execute the project.
Study Plan Creation Process
We first had a meeting with the platform team to understand what they wanted to get out of the study, which was mainly understanding what they use the platform for, how often they use it, user satisfaction and the reason for decreasing number of users.
Because this platform serves hundreds of users, we decided to utilize a survey to reach out a wide base and gather some preliminary insights if we wanted to conduct future interviews.
Before developing the survey questions, a senior UX researcher I worked with on this project, who recommended to take a look at two UX frameworks: Google HEART and SUS questionnaire

We decided to focus on "Happiness" because we wanted to gather information on user satisfaction, "Retention" as that was the main issue with the client team during this study, and "Task Success" because we wanted to understand whether the platform was making tasks difficult for users. Some survey questions were based upon these three components.
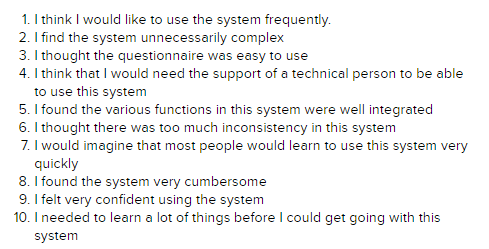
We adopted the SUS questionnaire to measure user satisfaction — corresponding to the Happiness dimension of the HEART framework — with minor modifications to replace generic language with the platform's name. We also felt the questionnaire's usability-focused questions could surface underlying reasons for the declining retention rate, making it do double duty across both the Happiness and Retention dimensions we'd prioritized.
Survey Questions
We utilized MS Forms to create the survey as it was the most accessible to the system's users. We collected data about the users' role, their frequency of utilizing the system, primary tasks they utilize the system for, the SUS questionnaire and any additional information.
We handed the study plan and survey to the platform team to execute. Due to time limitations at my internship, I was unable to view the insights for that study.
Learnings
Choosing the right methodology for the right question
This was my first project where I decided from scratch how to approach a research problem. Here, I chose a survey rather than interviews due to the amount of platform users and that the analysis required breadth, not depth
Frameworks are a starting point
We utilized the Google HEART framework, but I did not apply everything from this framework. I chose to focus on Happiness, Retention and Task Success from HEART because these categories matched the platform team's concern. This selective use of frameworks is more important than knowing its definition.
Survey Creation
While I have created surveys, this was the first time creating and launching a survey in corporate environment. I learned that surveys should not be too lengthy while also gathering the substantial information needed to have good insights on a product. Having an incentive system in place can also help for surveys to gain more respondents